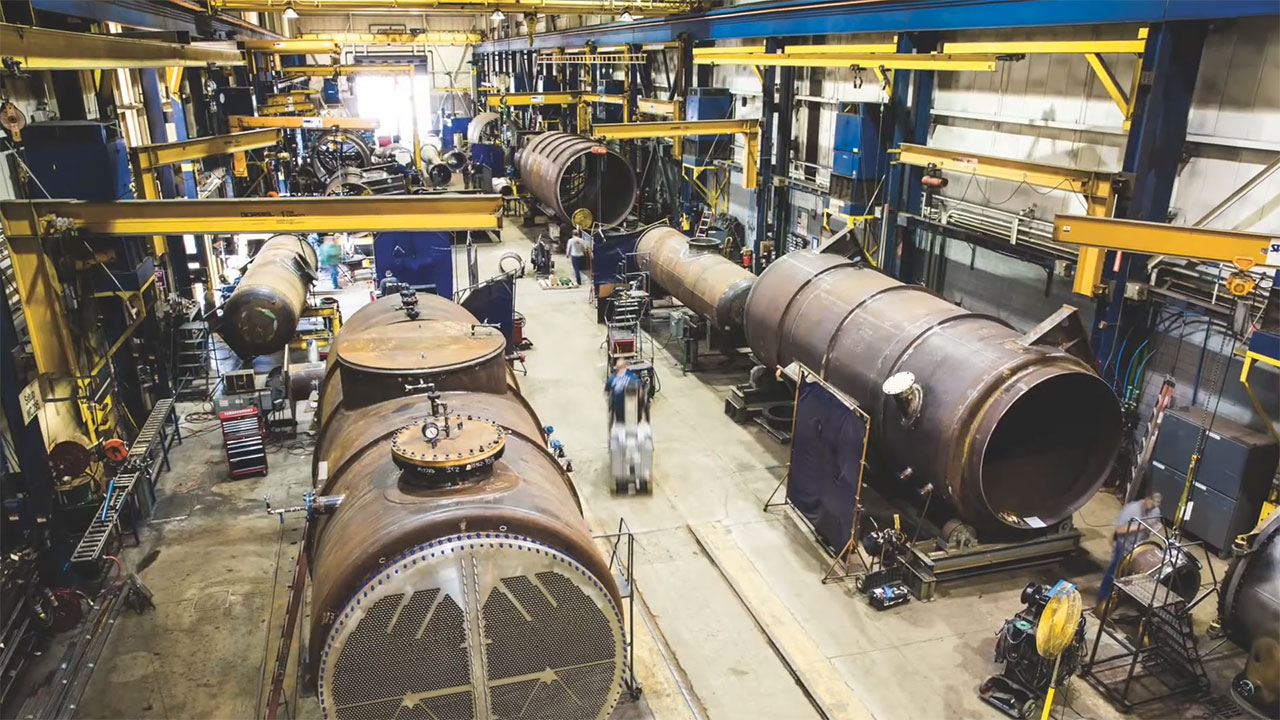
In 2024-2025, US manufacturing policy has created a sharply bifurcated reality for the sector, simultaneously erecting the steepest tariff wall in over a century while offering the most generous incentives in a generation. An aggressive trade strategy has pushed the average effective US tariff rate to 22.5%, its highest level since 1909, driven by a doubling of Section 232 tariffs on steel and aluminum to 50% and new duties on Chinese goods. This has created immense cost pressures and supply chain turmoil, evidenced by a $38 billion quarterly drop in manufacturing value-added output and the loss of 33,000 manufacturing jobs in 2025.
This protectionist push is creating clear winners and losers. Upstream producers like Cleveland-Cliffs have seen margins and stock prices rise, while downstream consumers in the automotive sector, like General Motors and Toyota, face billions in tariff-related profit hits. Concurrently, the Inflation Reduction Act (IRA) remains a powerful counter-current. Its Section 45X tax credits have catalyzed over $31 billion in announced clean energy manufacturing investments and fueled record manufacturing construction spending. This volatile landscape is further complicated by regulatory whiplash in emissions policy, where stringent new EPA methane rules coexist with the repeal of the Waste Emissions Charge and challenges to foundational climate regulations. For manufacturers, navigating this new era requires treating policy not as a fixed backdrop, but as a dynamic and critical input to every strategic decision.
Tariff Escalation & Trade War 2.0
The defining feature of 2025 manufacturing policy has been a rapid and broad-based escalation of tariffs, fundamentally altering cost structures and global trade flows.
Section 232 Metals at 50%: Cost Curves Flip for Upstream vs. Downstream
On June 3, 2025, President Trump doubled Section 232 tariffs on steel and aluminum imports from 25% to 50% ad valorem. This increase applied to all countries except the United Kingdom, which remains at a 25% rate. This followed earlier actions in February 2025 that eliminated all country-based exemptions for nations like Canada, Mexico, and the EU, and terminated the previous product exclusion process.
In its place, a new “inclusions process” was established, allowing stakeholders to request the addition of derivative products to the tariff list. The first round added 407 new product codes to the 50% tariff list in August 2025, covering items from vehicle parts to electronics. These actions have created a stark divide: domestic steel producers like Cleveland-Cliffs and Nucor are shielded from foreign competition, while downstream users in automotive and heavy equipment face massive cost hikes.
China-Specific Measures: De Minimis Killed, 20% Add-ons Reshape Electronics
Actions targeting China have been particularly aggressive. Effective May 2, 2025, the de minimis exemption (allowing duty-free entry for shipments under $800) was eliminated for products from China. These goods now face duties of 54% ad valorem or $100 per item, whichever is greater. This was preceded by an additional 20% ad valorem tariff on certain goods from China and Hong Kong, effective March 4, 2025. While the USTR extended 178 existing Section 301 tariff exclusions to November 2025, the overall environment has forced electronics and other import-dependent sectors to accelerate supply chain diversification away from China.
Retaliation and Shifting Trade Geographies
Key US trade partners have responded with force. Canada implemented retaliatory measures, including a 25% tariff on C$15.6 billion (about $11 billion USD) of US steel, aluminum, and auto imports, which remains active. These trade frictions are reshaping supply chain geography. Mexico has become the top US trade partner, with bilateral trade hitting $74.36 billion in July 2025 as companies nearshore operations. However, new US tariffs on non-USMCA-compliant Mexican goods could raise Mexico’s average effective tariff rate to 20.1%, complicating this shift.
Carbon & Criteria-Pollutant Regulation Whiplash
The regulatory landscape for emissions has been defined by contradictory movements, creating significant uncertainty for long-term capital planning.
EPA Methane Rule vs. Compliance Extensions
In March 2024, the EPA finalized stringent new rules (NSPS OOOOb/EG OOOOc) to cut methane and VOC emissions from oil and gas facilities, mandating advanced leak detection and “super-emitter” response programs. However, facing legal challenges from 24 states and industry petitions, the EPA issued compliance extensions in July 2025 for key provisions, pushing back deadlines for monitoring and equipment upgrades.
The Disappearing Stick: MERP Grants Survive, WEC Repealed
This dynamic is mirrored in the IRA’s methane programs. The Methane Emission Reduction Program (MERP) continues to provide over $1.3 billion in financial and technical assistance to help companies reduce emissions. In contrast, the Waste Emissions Charge (WEC)—a per-ton fee on methane leaks set to start at $900/ton—was repealed by Congress on March 14, 2025, just months before the first compliance filings were due. This removal of the primary enforcement “stick” leaves a policy mix of incentives and traditional regulation, but with a less predictable long-term trajectory, especially as the EPA considers rescinding the foundational Endangerment Finding for greenhouse gases.
Incentive Boom: IRA’s Section 45X Fuels Manufacturing Capex
While tariffs and regulatory uncertainty create headwinds, the IRA’s incentives provide a powerful tailwind, particularly for clean energy manufacturing. The Section 45X Advanced Manufacturing Production Credit (AMPTC) offers lucrative, production-based tax credits for US-made solar, wind, battery, and critical mineral components.
Crucial IRS guidance in late 2024 clarified eligibility and transferability rules, solidifying investor confidence and creating a liquid market for the credits, which now trade for 92-96 cents on the dollar. This has unleashed an investment surge: since the IRA’s passage, companies have announced 192 clean-tech manufacturing facilities, representing $31 billion in investment and nearly 27,000 jobs. This boom is reflected in macro data, with manufacturing construction spending hitting a record $238 billion in June 2024.
Sector Scorecard: Who Gains and Who Pays?
The collision of these policies is creating a clear divergence in performance across manufacturing sectors.
| Sector | Cost Structure Impact | Competitiveness Impact | Pricing Power Effect |
| Fabricated Metals | Exposed to 50% tariffs on imported raw materials, but shielded as domestic producers. | Primary Beneficiary. Tariffs and proposed FPFA are designed to boost domestic production, with modeling projecting a +3.7% output increase. | Increased Pricing Power. Reduced foreign competition allows domestic producers to pass on costs and improve margins. |
| Automotive (EVs) | Heavily impacted by 50% steel/aluminum tariffs, duties on Chinese electronics, and the proposed FPFA on battery inputs. | Complex & Negative. Nearshoring to Mexico is complicated by new tariffs. Trade deals with the EU/Japan (15% tariffs) may favor direct imports over North American production. | Margin Compression. OEMs are absorbing costs. GM reported a $1.1B Q2 profit hit; Toyota warned of a potential $9.5B impact. |
| Electronics | Significant cost increases from 20-30% tariffs on Chinese components and the elimination of the de minimis exemption. | Accelerated Diversification. Tariffs are forcing a “China-plus-one” strategy, but anti-circumvention duties add complexity. | Difficult Choice. Firms face a trade-off between absorbing costs (margin compression) and raising prices (risking demand). |
| Cement/Glass | Proposed FPFA would levy carbon-intensity tariffs, making imports from high-polluting countries more expensive. | Major Beneficiary. FPFA is projected to boost US cement production by +9.1% by penalizing carbon-intensive imports. | Increased Pricing Power. Protection from cheaper, carbon-intensive imports creates a more favorable domestic market. |
This divergence is stark at the company level. Domestic steel producer Cleveland-Cliffs saw its operating margins increase by 15% and its stock outperform the S&P 500 by 22% YTD in 2025. In contrast, Volkswagen Group reported a €1.3 billion hit in the first half of 2025 due to US tariffs, with its Audi and Porsche brands seeing profit drops of 64% and 91%, respectively.
The Road Ahead
In this volatile environment, manufacturers must adopt a “barbell” strategy: aggressively capture incentives while insulating operations from tariff shocks. This requires a new level of strategic agility. Procurement teams must pursue multi-origin sourcing and tariff engineering. Capex decisions must co-locate facilities to maximize Section 45X eligibility while minimizing tariff exposure. And leadership must maintain multiple, frequently refreshed scenarios for policy shifts, particularly regarding the IRA’s future and the legislative path of the Foreign Pollution Fee Act. The era of treating policy as a stable backdrop is over. Firms that learn to navigate its turbulence will convert 2025’s volatility into a durable competitive advantage.